Using AutoPhrase for Text Mining in 8-K reports
Our 3 main targets are data preparation, feature encoding and a test target. The data preparation target scrapes, cleans, and consolidates companies’ 8-K documents. Furthermore, it curates features such as EPS as well as price movements for the given companies. The feature encoding target creates encoded text vectors for each 8-K: both unigrams and quality phrases outputed by the AutoPhrase method. Users can configure parameters for both these targets in the ./config files.
Motivation
Stock market is one of the most popular markets that the investors like to put their money in. There are millions of investors who participate in the stock market investment directly or indirectly, such as by mutual fund, defined-benefit plan. Certainly, there are many people who research on the stock market, and they all know the information takes an important role in the decision making. According to the Strong Form Market Efficiency Theorem, the stock price is only determined by the new information; otherwise, it will be a random walk. However, there are thousands of information in this market everyday, and the investors can only pay attention to few of them. Therefore, the investors, especially the individual investors without the help of professional financial analyst, can only get the parts of the whole information, so his investment decisions may be biased. In this project, we want to solve this real-world problem to apply the Phrase mining technique to forecast the stock price and help the investors to make the decision.
Datasets
- 8-K Reports Database 1.4G
- 8-K Reports (RAR) 701M
- 8-K Reports With Info in JSON 6.1G
- Merged Dataset with Price label 618M
- Financial Quality Terms Web Mining from Investopedia
Data Prep
data_diris the file path to download files: 8-K’s, EPS, etc.raw_diris the directory to the raw dataraw_8k_fpis the file path with newly downloaded 8-K’s (should be the same as to_dir)raw_eps_fpis the file path with newly downloaded EPS information (should be the same as to_dir)processed_diris the directory to the processed datatestingis the status of whether we are doing testing (by default is false)
Feature Encoding
data_fileis the file path to outputed .csv file from the data prep targetphrase_fileis the file path to the quality phrases outputted by AutoPhrasen_unigramssets the top n unigrams to be encoded based on PMIthreshholdtakes quality phrases with a quality score above it to be encodedtrain_splitis the desired size of the training datatest_splitis the desired size of the test data (the validation_split is equal to 1 - train_split - test_split)
Test
- all the targets are the same as those in
Data Prep, excepttesting = true
Methodology
In this project, we will train a machine learning model based on the phrase vectors from the AutoPhrase model and compare with two baseline models. We are doing a classification task, instead of a regression task on the stock price. We label the price data as three price trend classes – “Up”, “Stay” and “Down”, based on the certain intervals of price change percentage. The first baseline model is the EPS model, which only uses the “Surpriseness” of the Earning per share to predict the price trend. The definition of “Surpriseness” will be described in the following section. The second baseline model is the linear model based on unigram given by Heeyoung Lee. He got around 50% accuracy on the testset, based only on unigram feature vectors. For this project, we will train our own models based on the AutoPhrase high-quality phrases and compare with the baseline models. We will also tune the hyper-parameters and compare different machine learning models, such as Random Forest, Logistic regression, SVM.
“Surpriseness” of EPS
We have the data for two kinds of EPS, the reported EPS and the concensus EPS, which is the estimated EPS provided by the stock researchers. The percentage difference between these two types of EPS is called the Surprise. If the reported EPS is higher than the concensus EPS, there is a positive Surprise, and we expect that the stock price will go up. If the reported EPS is lower than the concensus EPS, we expect the stock price will go down.
AutoPhrase
First, we apply the AutoPhrase model to our 8-K reports with the knowledge base quality terms from the Wikipedia provided by Professor Shang. We do some data analysis and visualization, but the outcome is not what we expect. There are many high-quality terms provided by AutoPhrase model, that are meaningless to a financial report. Based on the advice from Professor Shang, we find our own financial knowledge base. We do the web mining to the Investopedia website, which is a website to help people to study finance. We get about 7000 from the Investopedia and replace the wiki terms to the financial terms.
EDA
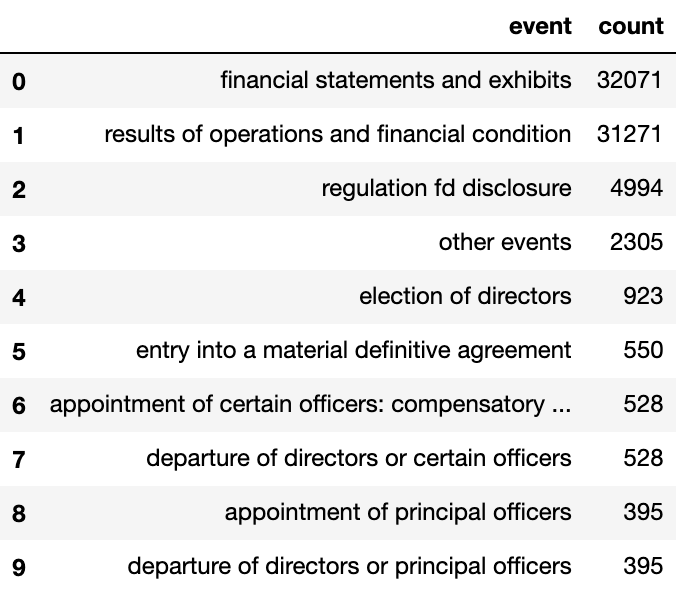
Figure lists some of the most common event types (reason for filing an 8-K) within the training set. Since different events can drastically change the contents of an 8-K form, we thought it as a significant feature in identifying variance among groups.
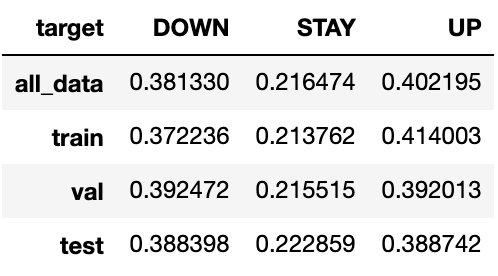
Figure shows that our data consists of around 38% “down”, 22% “stay”, and 40% “up” labels. This breakdown is also roughly consistent within each split: train, validation, and test. This will allow for our training data to match the rest of the splits as best as possible. Though the “stay” labels only make up a small minority of the data, it is more important to better predict “down” and “up” due to its larger price swings.
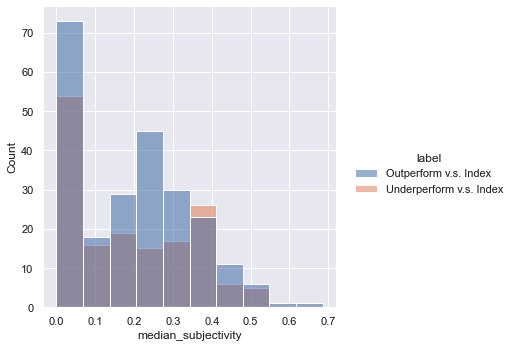
We also conducted some sentiment analysis on the sentences in the 8-K reports. We found out that the distribution of median subjectivity is different when comparing outperforming and underperforming securities.
Result Analysis
Model Performance
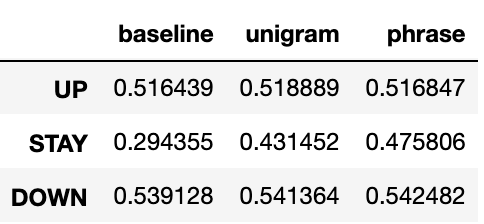
The figure show’s each model’s accuracy broken down by labels. All of the models were able to predict “up” and “down” better than chance which has the potential to provide great benefits in the financial world. Though all three models perform relatively the same for the “up” and “down” label, the unigram and the phrase models are able to predict the “stay” label with much higher accuracy. For our test set, the phrase model had the highest accuracy among all the 3 labels but only by a very small margin.
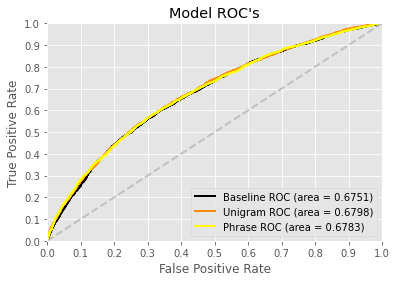
Through using micro-averages and the OneVsRestClassifier, ROC chart shows the estimated ROC curve for all three models. All three models are able to perform relatively the same in terms of sensitivity and specificity.
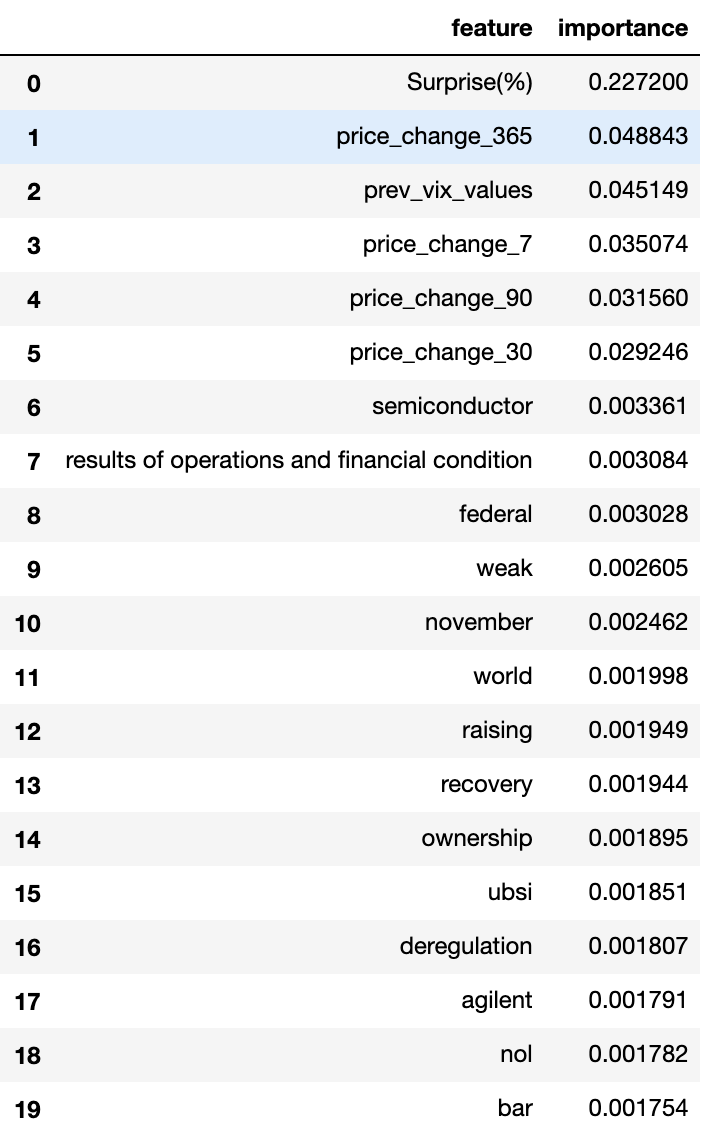
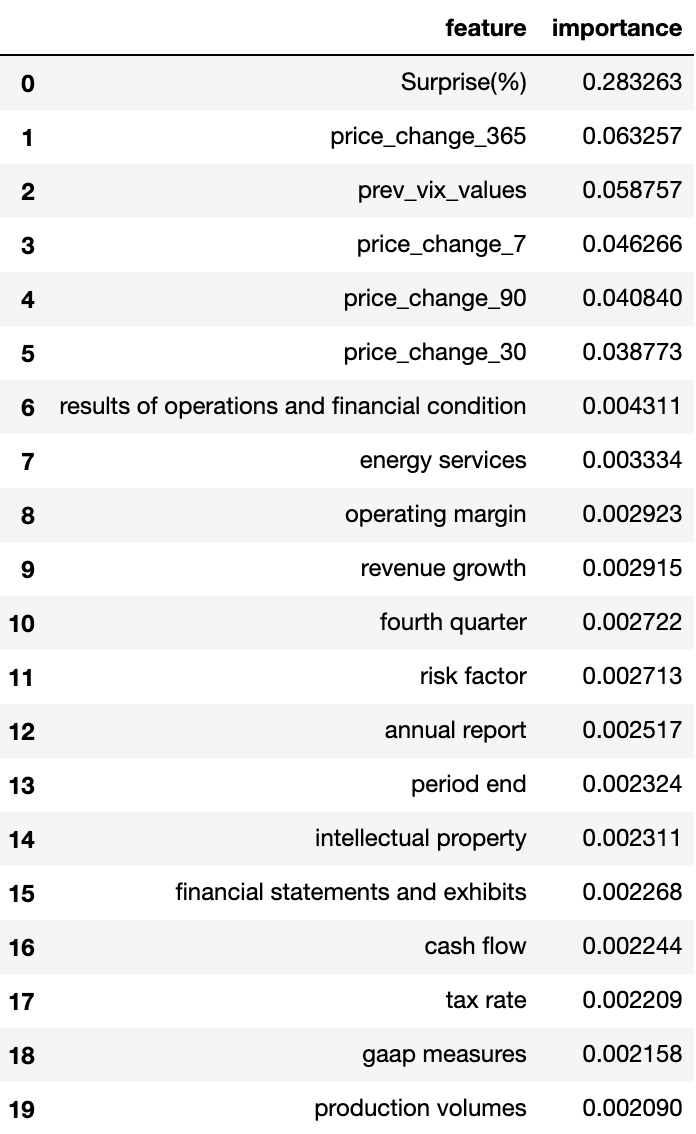
As shown by Figure for model importance, the model’s most important features were dominated by the main numerical features: price changes and earnings surprise (the most dominant feature). The high predicting power of these features helps to explain the baseline’s similar performance to the other enhanced models. Nevertheless, it is interesting to note some of the phrases and unigrams that contributed to the model’s predictability such as “weak” or “revenue growth”. Since many of these words/phrases make sense in a financial context, it helps to explain how some were able to have a small impact on the model, while words or phrases such as “gentleman” or “fee letters” have no impact on the model.
Simulation
We do a simulation to invest the stock market with our AutoPhrase model. We first train the models using data from 2002-2009. In each month of 2010-2012, we buy the stock with “UP” prediction result and short the stock with “DOWN” prediction, and calculate the average rate of return, assuming there is no commission fee. Note that this is the best way to simulation because the date and event of the 8-K reports are unpredictable. It is hard to buy all the stocks predicted to “UP”, because we don’t know the exact number of these stocks, and we are hard to assign the money to each of the stocks. In addition, the money needed for “short” is not same as “buy”. Therefore, our simulation is not the best simulation based on the reality.
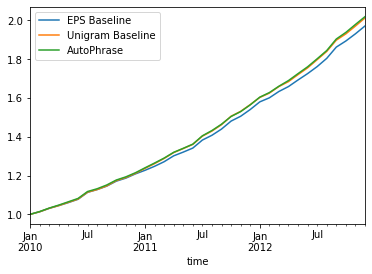
Figure 10 is the rate of return curve. (All the rate of reutrn is normalized by S&P 500 Index.) In this chart, the three models perform very similar. The rate of return for AutoPhrase model is highest, which is 201.8%, and the EPS Baseline is the lowest, which is 197.1\%. The return for Unigram model is in the middle, which is 201.2%.